To get the spreadsheet, enter your email into the box below.
The whole thing is about ten cell’s long, so it’s pretty simple, and I explain each of those cells below.
Notes
This calculator helps you estimate your “need to take risk” (how much risky/growth assets – stocks – you need to meet your goals), as explained towards the end of this article.
Asset allocation and your risk tolerance.
As mentioned in that article, there are other means to lower your need to take on a level of market risk that may be beyond your tolerance — increasing your savings rate, increasing accumulation time horizon (delaying retirement), or lowering retirement spending.
You can adjust the variables (years, savings amount, portfolio aggressiveness) until you can find a way to reach your goal.
Note that adding an extra couple of years to the end makes a disproportionately large difference because of compounding. Let’s say you go with a 3.5% withdrawal rate and therefore retire with 28 times your annual requirements. Delaying retirement by two years will see you accumulating a much higher net worth. It can be difficult to internalise how significant the effect of compounding is, so it helps to see it in the numbers.
The Fields
| Field | Explanation |
|---|---|
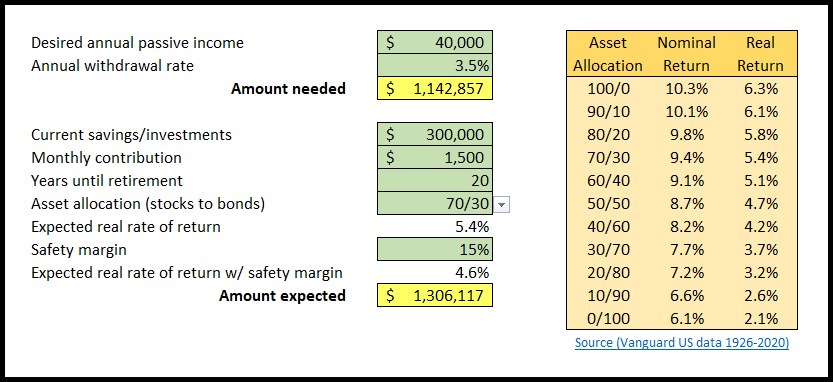
| Desired annual passive income | This depends on the individual, but as a guide, the ASFA Retirement Standard benchmarks the minimum annual cost of a comfortable or modest standard of living in retirement for singles and couples. As of January 2022:
|
| Annual withdrawal rate | This should be a withdrawal rate that has historically had a high degree of lasting your retirement. The commonly quoted 4% rule was for a 30-year retirement, and it appears that it is around 3.5% for early retirees. The definitive guide can be found at Early Retirement Now. There is also an Australian safe withdrawal rate series of articles at Ordinary Dollar. It appears the Ordinary Dollar site was taken down, but there’s an archive in the WayBack Machine |
| Amount needed |
Calculated based on the above two inputs using =(desired_income/withdrawal_rate) |
| Field | Explanation |
| Current savings/investments | Includes savings and investments inside and outside of super. |
| Monthly contribution | A combination of super contribution and savings outside super. |
| Years until retirement. | Self-explanatory |
| Asset allocation (stocks to bonds) |
Select this from the dropdown. As you change it, it pulls the next item (expected real rate of return) from the table on the right. An asset allocation of 70/30 means 70% stocks and 30% bonds. You’ll notice that as your allocation to stocks increases, your expected return increases. That’s because stocks have a higher expected return than bonds. The following articles will help you understand more about deciding on an asset allocation. Having a higher allocation than your risk tolerance can be dangerous. Return is only one aspect of deciding on an asset allocation. The risk-reward spectrum Asset allocation and your risk tolerance |
| Expected real return of stocks | “Real” means after inflation. The following short article is an explanation on the effect of inflation. Inflation and why you can’t just put everything in fixed-term deposits. |
| Safety margin | There are two problems with using historical data.
|
| Amount expected | Calculated based on the above inputs using excels FV function =FV(expected_return_with_safety_margin,years_until_retirement,-12 * monthly_contribution,-1 * current_savings,0) |