If you haven’t already got a good understanding of what superannuation is, superannuation contribution types, and superannuation account types, it would be worth having a read of those first and coming back to this so that you have a solid understanding of what super is before deciding how to invest your super. Don’t worry – even if you’re a slow reader, it won’t take you long.
The mostly commonly asked question about super is how to choose a super fund and how to invest your super. Most people only look at the latest performance figures, which is a very poor indication of future performance and misses the most important considerations.
Before we start, a quick note – a small part of the population has access to untaxed super funds (typically government employees) or defined benefit super funds. If this is you, this article may not apply to you. You can contact your super fund or speak to an adviser who specialises in these to help you understand it.
Quick Links
Pre-mixed vs single asset class investments
MySuper and YourSuper
The difference fees make
Investment management style
Asset allocation
Pre-mixed vs single asset class investments
In your super, you can choose pre-mixed investments or single asset class investments.
Pre-mixed options are ready-made, all-in-one, diversified investment portfolios made up of multiple asset classes, including shares, property, cash and bonds. These typically include high-growth, growth, balanced, and conservative investment options. You decide on your risk tolerance, select one of the options to suit it, and there is nothing more to do. No need to pay an adviser ongoing fees to manage it and no need to actively monitor your investments. It is a set-and-forget investment that lets you get on with your life. The downside to pre-mixed investment options is that it is actively managed and has higher fees than index-based investment options.
Single asset class investment options are simply the components of the pre-mixed investments, where you get to choose which ones and how much to use. The real benefit of single-asset-class investment options is that several industry super funds offer low-cost index-based versions of these investment options, so you can create your own version of the pre-mixed investment option, while avoiding the problems of active management and high fees.
A more in-depth discussion can be found here: Pre-mixed vs single-asset-class investments
MySuper and YourSuper
In an attempt to protect the public, the government mandated that for a super fund to be used as a default fund when someone starts a new job without selecting their own super fund, the super fund must select an investment option that is simple, low-cost, and easy to compare. This will be the fund’s MySuper investment option and is the default fund you will have been put into if you never chose your investment options in super when you started your job.
These are typically the super fund’s pre-mixed balanced investment option with around 70% growth assets and 30% defensive assets (although this ratio varies between MySuper funds) and fees of about 0.70-1.00%, which is not my definition of low cost. This default option is far from optimal for most people and can be improved.
The YourSuper comparison tool was created by the government with the intention to make it easy to compare the performance of super funds, but despite the good intentions, it is very poorly implemented as it limits itself to only the default MySuper investment options, which means:
1. It does not compare against low-cost index options at a fifth of the cost or less (sometimes less than a tenth of the cost); and more importantly:
2. Each fund’s MySuper investment option has its own asset allocation, so they are not comparable. For example, one fund’s MySuper product could have 60% growth assets and another 80% growth assets, and the latter will likely have had higher returns, but it is not from superior management but rather due to a different risk profile that doesn’t suit an investor with a balanced risk profile.
This is a link to a spreadsheet by SwaankyKoala on Reddit with the fees and performance of investment options of loads of super funds across Australian vs International, High growth, SRI, Passive vs Active, and more, is far superior.
Super Fund Comparison Spreadsheet
How to invest your super
You will need to consider 3 things when choosing how to invest your super:
The difference fees make
Fees matter — A LOT
A 1% fee sounds like a tiny amount, but that is 1% of your entire balance, not of your profit. Historical returns from the stock market have been 10% p.a., so 1% fees are actually a whopping 10% of your returns lost every year.
Not only that, but inflation has historically been 4% p.a. over the long term, and historical returns after inflation are accounted for have been 6%, so 1% fees are over 16% of your real returns lost each year.
And worse still is that not only do these fees eat into your returns, but you miss out on the compounding of those returns, into the future, costing you much more.
This article explains it in more detail: How 1% fees cost you a third of your nest egg
The government legislated MySuper options have only been around a short while, and many other investment options have fees of 1% or more.
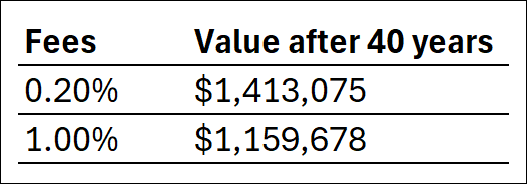
Let’s take a look at the difference between 0.20% fees vs 1% fees for someone on a $80,000 salary, after 40 years of accumulating $8,800 p.a. (11% compulsory employer contributions) at a 6% p.a. inflation-adjusted return.

That’s over $253,000 (in today’s buying power) or almost 4 years of after-tax income lost.
That means four more years of working to save the same amount of money had you not paid attention to super fees.
Here are the figures for other income amounts and fee amounts.

Investment management style — active vs passive
As mentioned in the section on investing, the data shows that over 80% of actively managed funds fail even to match the performance of the index after fees – and this is consistent across geographies and time periods. You have to be lucky even to match the index, let alone outperform it.
What about funds that have a good track record of performance? Again, no. SPIVA reports show that from funds that outperformed the index over 5 years, 74.8% failed to outperform the market in the following 5 years. Since that’s the case, it doesn’t make much sense to pay the higher fee that comes with these funds, yet that’s exactly what you are doing if you choose actively managed investment options. Actively managed funds need to pay higher costs to ‘experts’ to make these investment decisions. Meanwhile, the index has consistently performed in the top quartile of funds year in and year out, generally for a tiny fee of about 0.10%.
Take a look at the option you selected in super and check the fees you are paying. If it is not index-tracking, it is likely in the neighbourhood of 0.70% p.a. for the lower cost actively managed investment options, and much more for others. You need a good reason to be paying over about 0.30%, considering the hit your nest egg will take as a result. And that’s 0.30% in total, including:
- Fund admin fee
- Investment fee
- Indirect costs
- Ongoing adviser fees should be avoided
Asset allocation – the right mix of growth to defensive assets
A lot of people have heard about low-cost index funds, which is great, but many people select the ‘index balanced’ option because it has the word ‘index’ in the name, but the index balanced option only has about 70% in growth assets (shares) and the remaining 30% in defensive assets (bonds and cash) earning very little.
It is a common mistake for newbies to compare the pre-mixed growth investment option against the index balanced option to see how indexing compares.
So let’s take a look at 10-year returns from Australian Retirement Trust at the start of 2024.
| Balanced index | 7.13% |
| Growth | 8.95% |
But is that due to superior management skill, or just using a higher proportion of growth assets in their asset allocation?
Let’s compare indexed investment options to actively managed investment options in a like-for-like comparison where the indexed investments use the same asset allocation, which for the growth option is 90% growth and 10% defensive assets.
| International Shares – Index | 10.95% |
| Australian Shares – Index | 8.26% |
| Diversified Bonds – Index | 2.35% |
| (60% x 10.95%) + (30% x 8.26%) + (10% x 2.35%) | = | 9.28% |
The take home point of the above is this – asset allocation matters as much as using low-cost investments.
The balanced index option satisfies the low-cost part, but it only has about 70% in growth assets (shares) and the remaining 30% in defensive assets (bonds and cash), and this is not suitable for everyone – particularly those with a high risk tolerance.
Here is a risk profile summary.
| Risk Profile | Asset Allocation (% growth assets) |
Suitability |
|---|---|---|
| Very aggressive | 90%+ | Long investing time horizon (15+ years), or people under 40, still accumulating, and with a very high risk tolerance. |
| Aggressive | 75% | Long investing time horizon (10+ years), or people under 50, still accumulating, but with a high risk tolerance. |
| Balanced | 60% | Medium-term investment time horizon (8-9 years) or older people approaching or in retirement. |
| Moderately conservative |
45% | Short investment time horizon (6-7 years) or older people with significant assets (little growth required). |
| Conservative | 30% | Short investment time horizon (4-5 years) or older people with significant assets (little to no growth required). |
Risk tolerance was explained in the investing section under The risk-reward spectrum and Asset allocation and your risk tolerance (so have a read of those if you haven’t already). And as you continue reading the next few articles from that section of the website on Building a passive portfolio, you will see that building a passive portfolio is surprisingly simple once you strip away the vested interest of those who profit from making it sound complicated. In summary, you need to determine the following:
- Growth-to-defensive ratio based on your risk tolerance
- International to Australian shares ratio
- AUD to non-AUD ratio.
Your asset allocation (in particular, the growth-to-defensive ratio) determines 90% of your expected returns.
A good rule of thumb is that if you can’t access the money for at least 20 years, you have the timeframe to handle the short term ups and downs of growth assets, and a high allocation to growth assets will give you a higher expected return for that higher risk that you are able to tolerate with your long investment time horizon.
For instance, over the past 100 years, a portfolio of 100% stocks has returned 10.3% annualised, whereas a portfolio of 70% stocks and 30% bonds has returned 9.4%, almost a full percentage lower.
And just to re-iterate from earlier, a 1% lower return from a 10.3% return is a full 10th of the return lost each year.
And this loss compounds.
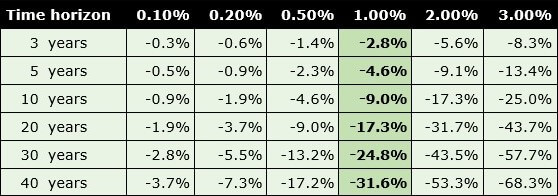
Here’s a chart showing how much lower your return is based on the reduced return, with the 1% lower return highlighted.

Over 20 years, that’s a whopping 17.3% lower return. Over 30 years, 24.8%, and over 40 years, 31.6%. These are serious amounts of money. Don’t let the fact that 1% sounds like a small amount fool you.
And this is in addition to the fees mentioned above.
When you combine 1% lost in fees and 1% lost from inappropriately conservative investment options, you are looking at a staggering amount of lost money. After 40 years of saving $7,000 per year, the difference between a 0.2% fee with 100% growth assets vs 1% fee with 70% growth assets is $1,083,333 vs $665,178. And that’s by simply changing to low-cost investment options that suit a high risk tolerance.
So if you have a long time horizon (which is anyone that cannot access super for 20 years), and you’re confident you won’t panic-sell and switch to cash during economic downturns, the way to get a 100% equity allocation using index options in super is to use indexed single asset class investment options and combine them yourself.
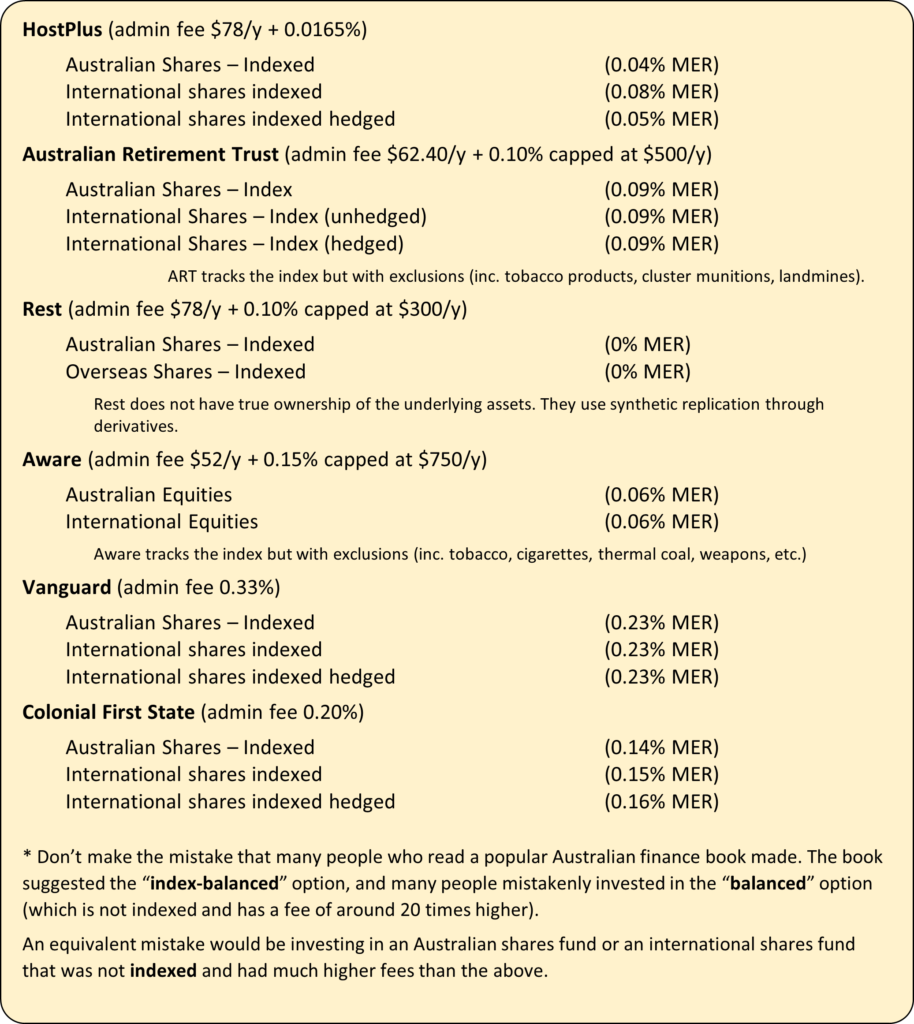
Here are some industry super funds with their low-cost index options to achieve an aggressive asset allocation (in no particular order):

Super Fund Comparison Spreadsheet
Based on the section on investing, you can decide on the ratio between these three parts:
- Australian shares
- International shares (unhedged)
- International shares hedged.
Final thoughts
You now have an overview of the key points for choosing how to invest your super:
- fees
- active vs passive management, and
- asset allocation.
This should give you a good base of knowledge to evaluate recommendations and figure out if the source of the recommendation knows what they are talking about or if they are leaving out key information (in which case, be careful accepting anything they say, and do further research first).
